
At Navionics, we continuously enhance our products and technology to provide our customers with the best possible experience, the most complete details, and relevant content. We are glad to announce that as part of this effort, we have developed a new and improved way to integrate into our charts the sonar logs contributed by our users all around the world. Now you will be able to enjoy a seamless experience when using the SonarChart layer.
What has changed?
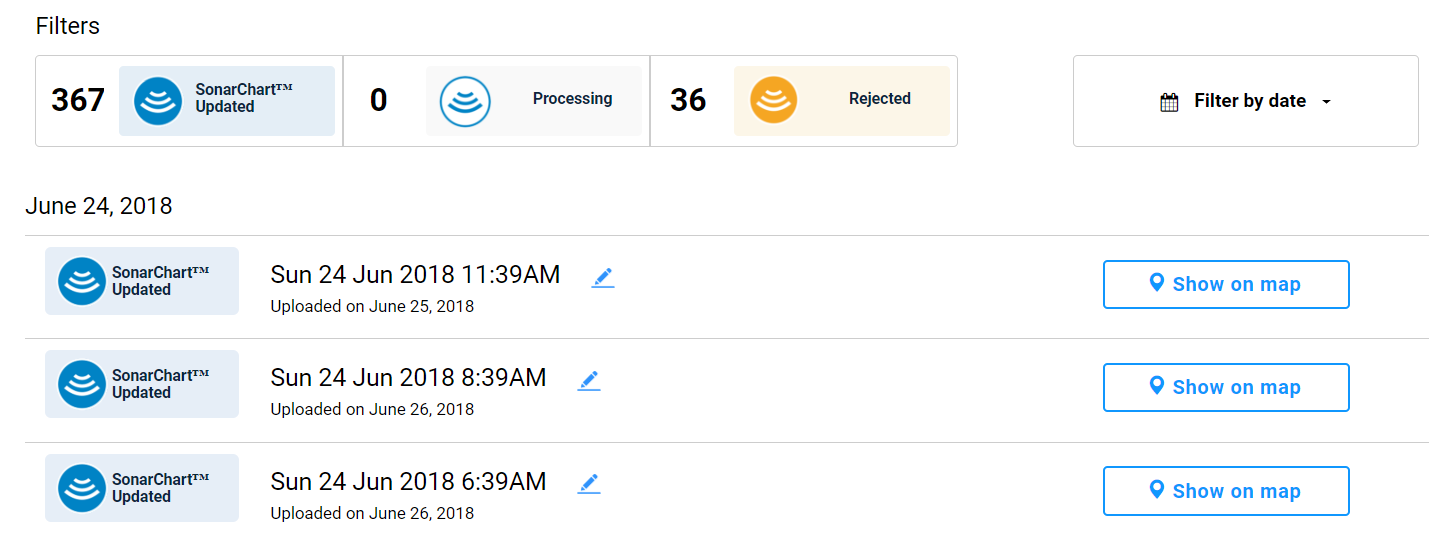
We can do it faster! - For years now, we’ve been adding depth data contributed by the Navionics community using the SonarChart Live and other recording features at a speed that was unmatched by our competition. Through the help of state of the art computing, intricate algorithms, significant infrastructure investment and good ol’ fashioned sweat, recent improvements to system now validate and process those sonar logs at a higher speed. This allows us to update the latest data in record time, often by orders of magnitude. Log on to www.navionics.com to check the status of your sonar contribution within the account page.
Every time you update your chart before going out on the water, you’ll have the freshest data available.
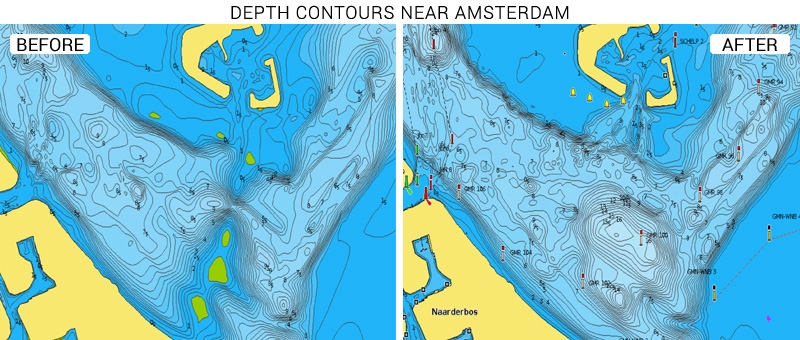
We can do it better! - OK, fast is important, but for us the quality of the data is our primary focus, that’s why we have also improved the depth modelling validation process which results in a higher quality cartographic fidelity. The results can be obvious, see here below how depth contours near Amsterdam have improved.
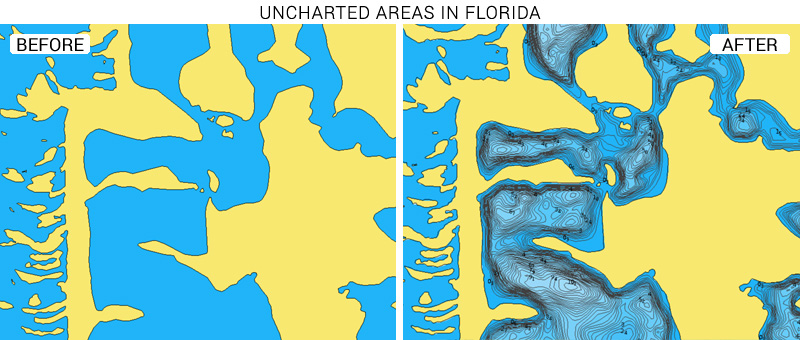
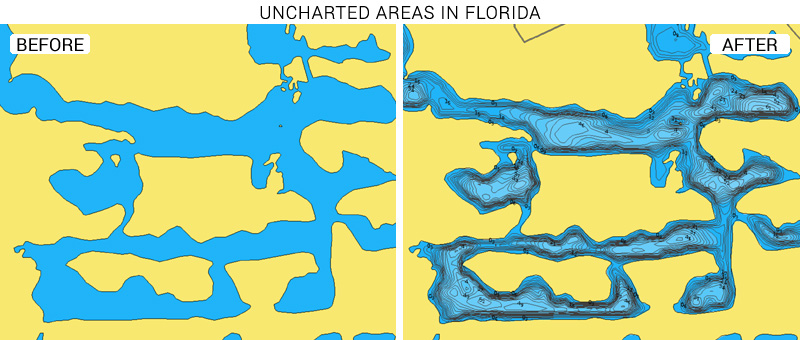
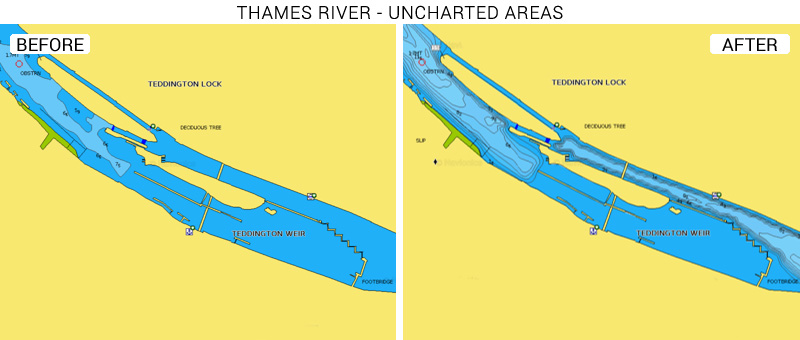
With a growing crowd comes efficiency! - With the help of a growing Navionics community, thousands and thousands of you have contributed enough data in geographies where there may not have been any known prior data source, that SonarChart can now reflect the ever-changing conditions of sea, lake, and river bottoms at a very local level. With the crowd filling in those gaps, we can take advantage of the validation improvements and make use of more of the sonar logs we receive. We can use data that the previous system could not process or had rejected because without crowd validation our confidence metrics were not yet to our standard for log acceptance. Navionics can now improve areas already covered with depth contours on our maps, but also, and more importantly, can create new maps of uncharted waters. In the images below, you can see examples from previously uncharted areas in Florida or the Thames River where the local Hydrographic office does not have coverage.
Want better charts and to contribute SonarChart enhancement for all boaters? Learn how.
Learn more about chart updates and discover our latest changes!
GET UPDATED CHARTS!
With an active subscription
- Have a plotter card? Plug your card into a PC and download. Or, if you also have our Boating app, do it wirelessly with Plotter Sync. Download
- Have the Boating app? Open the app and tap Menu > Update All.
With an expired subscription
- Have a plotter card? Choose one of the available options to easily renew. Renew
- Have the Boating app? Open the app, tap Menu > Charts & Upgrades.
IF YOU DON’T HAVE NAVIONICS YET
- Have a plotter? Choose Navionics+ and Platinum+ Shop Now
- Have a mobile? Download the free Boating Marine & Lakes app that provides a 2-week free trial or the paid apps!Shop Now